Physical shipping data still tells a different story than the diplomacy
This week again showed how far diplomatic signaling can drift from what is actually moving through the Strait of Hormuz. Qatar’s foreign ministry said draft language for a settlement between Washington and Tehran was circulating among the parties, and Treasury Secretary Scott Bessent told CNBC a deal to reopen the strait was possible “today or tomorrow.” Reporting from the same week also recorded President Trump using markedly more threatening language toward Iran, and Iranian officials publicly describing a settlement that would leave Tehran, not international shippers, in effective control of vessel movement through the strait. Those two positions are not close to converging.
Set against that noise, tanker flows through the strait have moved up only gradually. Ship tracking data compiled by Bloomberg shows commercial cargo vessel crossings climbing off their June lows but still running well below the peak seen in late June, with clearance levels described as close to recent lows even during pauses in direct strikes. Brent crude fell below $80 a barrel for the first time since mid July before steadying in a range in the high $70s to low $80s by 5 August, a reminder that headline relief rallies have so far been shallower and shorter lived than the diplomatic language behind them would suggest.
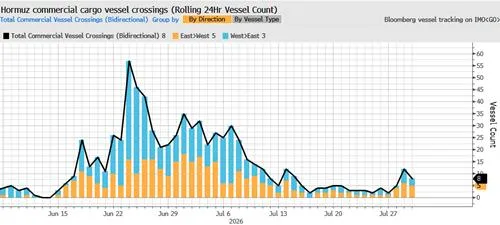
Commercial cargo vessel crossings through the Strait of Hormuz, rolling 24 hour count. Source: Bloomberg vessel tracking data.
The practical takeaway for energy buyers is not which headline to believe this week, but how much of this volatility is already translated into products and contracts they actually use. That distinction, between crude oil prices and the tighter products market sitting behind them, is where this edition’s crude oil section picks up.
Crude oil
Diesel, not crude, is where the supply squeeze actually lives
US commercial crude inventories and the Strategic Petroleum Reserve (SPR) have both been drawn down sharply since the conflict escalated. Weekly data compiled from DOE and API figures showed a 7.17 million barrel commercial crude draw alongside a further drop at the Cushing, Oklahoma storage hub, which the US Energy Information Administration confirms sits near multi-decade lows. The Strategic Petroleum Reserve itself fell to 307.7 million barrels in the week to 24 July, its lowest level in more than 40 years. Refineries have responded by running near capacity, with US utilization above 97%, the highest since 2018, yet that has not resolved the tightness in refined products.
US Strategic Petroleum Reserve and commercial crude inventory data, weekly change. Source: US Department of Energy.
Analysts at Goldman Sachs described diesel as the “epicenter of the supply squeeze” in a note relayed by Bloomberg, pointing to global refinery throughput down around 6.5 million barrels a day year over year as outages hit Russian and Middle Eastern capacity, only partly offset by higher runs in the Americas and Africa. Diesel exports have fallen roughly 35% from a year earlier, and the Nymex diesel crack, the margin refiners earn on turning crude into diesel, has climbed well above where it stood earlier this year even as the underlying crude price has been more volatile than directional. Brent’s own options market reflects the same unease: implied volatility and skew have both picked up again in recent weeks, a sign traders are paying up for protection against further disruption rather than betting on a swift resolution.
Nymex first month diesel crack margin versus front month WTI crude. Source: market data via Bloomberg.
Estimated global refinery runs, year over year change. Source: IEA, Kpler, Goldman Sachs Global Investment Research.
Elsewhere in the supply chain, Venezuela’s expected oil revival has moved more slowly than Washington anticipated. Seven months after the change in government there, ExxonMobil and Chevron remain cautious about committing fresh capital, wary of the country’s history of nationalizing foreign assets. Chevron has lifted output through operational improvements to near 300,000 barrels a day without new investment, and Francisco Monaldi of Rice University’s Baker Institute, who follows the talks closely, summarized the mood among the majors simply: they “have been burned twice.” That caution limits how quickly any spare capacity elsewhere could offset the current squeeze.
Gulf governments appear to be treating the disruption as durable rather than temporary. Regional bond sales have hit a record pace this year, with Gulf Cooperation Council issuance reaching roughly $112 billion so far in 2026, comfortably ahead of any prior year, much of it earmarked for ports and infrastructure that would let crude and gas move around the Strait of Hormuz rather than through it. UAE borrowers alone have been selling dollar and euro bonds at a record pace, with lenders such as First Abu Dhabi Bank and Emirates NBD among the most active issuers of the year.
Gulf sovereign and corporate bond issuance, January 1 to July 23 each year. Chart: Ed Clowes/Semafor. Source: Bloomberg.
For businesses on fixed energy contracts, this week’s oil price swings are largely someone else’s problem. For those on variable or spot linked pricing in transport, agriculture and industrial heating, the more relevant number is not Brent but the diesel margin sitting on top of it, which has moved further and faster than crude itself, and the options market’s own pricing of further disruption is a useful early warning signal in its own right.
Crude Oil Price Brent Oct 2026 ($/barrel) – day cloud candle, log scale
ElecÂtricity
Grid capacity, not generation, is the new bottleneck on both sides of the Atlantic
Britain’s energy regulator Ofgem proposed a new Data Centre Commitment Fee at the end of July, set between £237,500 and £712,500 per megawatt, refundable once a project reaches connection status but forfeited if it exits the queue early. The measure follows a surge in UK connection applications from roughly 41 gigawatts to 125 gigawatts in under 2 years, the large majority of it linked to data center demand, and builds on earlier reforms that Ofgem says already brought forward 7.8 gigawatts of viable projects by an average of 6 years. “Where speculative projects take up space in the queue, they can delay other schemes,” Ofgem’s Eleanor Warburton said.
The United States saw a starker illustration of the same pressure. The Department of Energy issued an emergency order on 26 July allowing generators serving the Southwest Power Pool’s 17 states to run beyond normal operating limits during a heat driven demand spike, and authorized grid operators to draw on backup generation at data centers and other large sites as a last resort before declaring the highest level of emergency action. The department cited over $44 billion a year in nationwide outage costs and pointed to more than 35 gigawatts of unused backup generation capacity that could be called upon. Utilities are seeing the same demand pattern from data centers specifically: PG&E told investors its data center interconnection pipeline reached 12.7 gigawatts in the second quarter, underpinning a $73 billion 5 year capital plan even as the company tightens vetting of which projects it counts and continues absorbing wildfire related liabilities, including a proposed $22 million state penalty tied to the 2022 Mosquito Fire.
The Netherlands is not exempt from this dynamic. TenneT’s own market reporting shows objections to grid expansion projects have roughly doubled year over year, more than 11,000 customers remain on Enexis’s connection waiting list, and a further 15,000 businesses are waiting nationwide, with objection procedures adding around 2 years to project timelines on average. Utrecht only reopened its own connection waiting list on 1 July after a period of closure, and congestion management costs rose 42% to €48 million, concentrated in the Flevoland, Gelderland and Utrecht region.
In the UK, the US and the Netherlands alike, the binding constraint on new electricity demand is increasingly a queue rather than a shortage of proposed generation. For hospitals, industrial sites and horticultural growers planning capacity expansions, connection timing is becoming as important a variable to plan around as the electricity price itself.
A quiet gas market masks a still fragile supply chain
Egyptian authorities confirmed a fire broke out on two gas carrying vessels, including the US owned floating storage and regasification unit Energos Winter, moored at the Damietta terminal on 29 July, after what maritime security firm Ambrey and Egypt’s own account both described as a drone strike. Coverage from the region noted no injuries and that no group has claimed responsibility, while Iranian officials have denied involvement. The incident itself is confirmed, even though who carried it out is not.
Energos Winter tracked moored off Damietta, Egypt, 29 July 2026. Source: Bloomberg Finance L.P., Mapbox, OpenStreetMap.
European gas fundamentals have so far absorbed that shock without much visible strain. Dutch TTF front month gas was trading around €55 per megawatt hour on 4 August, and US storage sat 185 billion cubic feet above its 5 year average in the week to 24 July. The International Energy Agency’s latest quarterly outlook projects European demand falling more than 2% this year, with a recent premium for Asian buyers pulling flexible LNG cargoes away from Europe.
Comfortable storage and a soft demand outlook are the reasons TTF has not reacted sharply to a confirmed attack on Mediterranean gas infrastructure. That comfort should not be mistaken for structural safety: a single incident escalating into a pattern would find European buyers, particularly those on indexed or variable contracts, with less cushion than current prices suggest.
Price TTF gas supply year 2027 (eur/MWh) – day cloud candle, log scale
Coal
Fossil fuels’ 25 year persistence meets a market that is no longer growing
The Energy Institute’s Statistical Review of World Energy, now in its 75th edition, puts 2025 global energy consumption at just over 600 exajoules, of which fossil fuels supplied roughly 86%, a share barely changed from 87% a quarter century ago, according to an independent analysis of the same data. Coal alone rose from 92.8 to 166 exajoules of consumption over that period, a 79% increase, even as renewables grew from close to nothing to just under 6% of the global total. The pattern looks different inside the United States, where total energy use actually edged down slightly over the same 25 years, coal consumption collapsed from 24.4 to 8.7 exajoules, and natural gas took its place, rising from 23.7 to 32.9 exajoules as the country’s fossil fuel share slipped from 89 to 83%.
World and US fuel consumption trends, 2000 to 2025. Compiled from Energy Institute Statistical Review of World Energy data.
That long run persistence sits awkwardly next to the most recent year of data. The International Energy Agency’s 2026 Global Energy Review shows worldwide coal demand rose only 0.4% in 2025, essentially flat, with China unchanged, the United States up around 10%, the European Union down 5%, and India actually down about 1%. That last figure sits in tension with a widely cited forecast from the Centre for Research on Energy and Clean Air warning that a weather driven power deficit of up to 18 terawatt hours could push India’s coal share, already above 70% of generation, higher still over the coming year. Both can be true at once: a structural dependence on coal that has barely moved in 25 years, and a near term demand picture in India that has, so far, not confirmed the deficit scenario.
None of this moves European gas fired power prices directly, but it is a useful check on both ends of the coal narrative: neither the case that fossil fuel dependence is unwinding, nor the case that a coal driven crunch in Asia is already underway, is currently supported by the most recent data. Businesses budgeting on the assumption that coal is a shrinking part of the energy mix should treat that as a multi year trend rather than a straight line.
India’s climate retreat and a snowfall correction both complicate the net zero narrative
India has withdrawn its bid to host the COP33 UN climate conference in 2028, a plan first floated by Prime Minister Modi in 2023. India’s environment ministry cited only a review of its 2028 commitments, without further public explanation. Turkiye and Ethiopia have already secured the next two hosting slots, and no replacement host in the Asia Pacific rotation for 2028 has yet been confirmed.
Separately, a peer reviewed study involving the British Antarctic Survey and the UK Met Office used frozen high altitude lakes as natural pressure sensors, an alternative to conventional rain gauges, to check regional snowfall models against actual accumulation. Reporting on the findings points to a significant underestimate of seasonal snow at one Himalayan site, a reminder that hydrological models feeding into water and energy planning for South Asia carry more uncertainty than is often assumed.
European carbon allowances have moved with more conviction than either story. The EU ETS benchmark EUA contract traded near €81 per tonne on 4 August, up around 14% from a year earlier.
European industrial and healthcare sector energy buyers should note that the EU’s own carbon cost trajectory is set by its cap, not by what happens at any single COP. A large emerging economy stepping back from hosting duties changes the diplomatic weather, but it does not change the compliance cost businesses in the Netherlands are already carrying, and that cost has been rising for a year.
Price Emission Rights – CAL 27 (eur/t) – day cloud candle, log scale
RenewÂable
Solar’s third terawatt arrived quietly, and Texas just tested how data centers fit around it
The world passed 3 terawatts of cumulative installed solar capacity this summer, Bloomberg reported, with the first terawatt having taken a decade to install and the next two arriving in under five years combined. BloombergNEF forecasts more than 9 terawatts by 2036. The number of countries with at least 1 gigawatt installed has grown to 74, up from 42 in 2020, with China still the largest single driver of deployment but faster growth now visible in Pakistan, Nigeria, the Philippines, Cuba and Lebanon, largely through rooftop installations rather than utility scale projects. “Without enough energy storage, you cannot maximize solar’s potential,” BloombergNEF’s head of solar research Lara Hayim said, pointing to battery buildout as the main constraint on how far the boom can extend.
Texas provided an early test of how new, large electricity consumers fit around that growth. The Public Utility Commission of Texas approved a 260 megawatt AI data center colocated with a similarly sized wind farm under the state’s SB6 law, on condition the data center can curtail its full load within 30 minutes during grid emergencies and cannot be paid separately for doing so. ERCOT has confirmed at least one further colocation deal under the same framework, with more under review, and the industry is watching a pending application to pair a data center campus with the Comanche Peak nuclear plant as the next test of how far the model can be pushed.
The Netherlands is living the other side of that coin. TenneT reported that negative price hours rose from 458 in 2024 to 584 in 2025, and market based renewables curtailment exceeded 1 terawatt hour, up more than 33% year over year, concentrated in the same Flevoland, Gelderland and Utrecht corridor already straining under connection queues, as solar and wind supply increasingly outpaces the grid’s ability to move or store it.
Cheap daytime power and rising curtailment are two sides of the same story. For horticultural and industrial energy buyers able to shift load toward the middle of the day, or to add on site generation and storage, that gap between abundant supply and constrained delivery is increasing where the near term value sits, in the Netherlands as much as in Texas.